New annual statistics for workplace health and safety were published in November last year, alongside a new report for construction. How does the record of the industry compare?
We all have a right to not get hurt or ill through work. But how much higher are the risks for being injured or getting ill if your job involves going to a building site every day?
Annual figures from the Health and Safety Executive (HSE), released in November 2022 for the 2021/22 period, showed that statistically construction can be a risker place to earn a living – but improvements are being made.
Fatalities
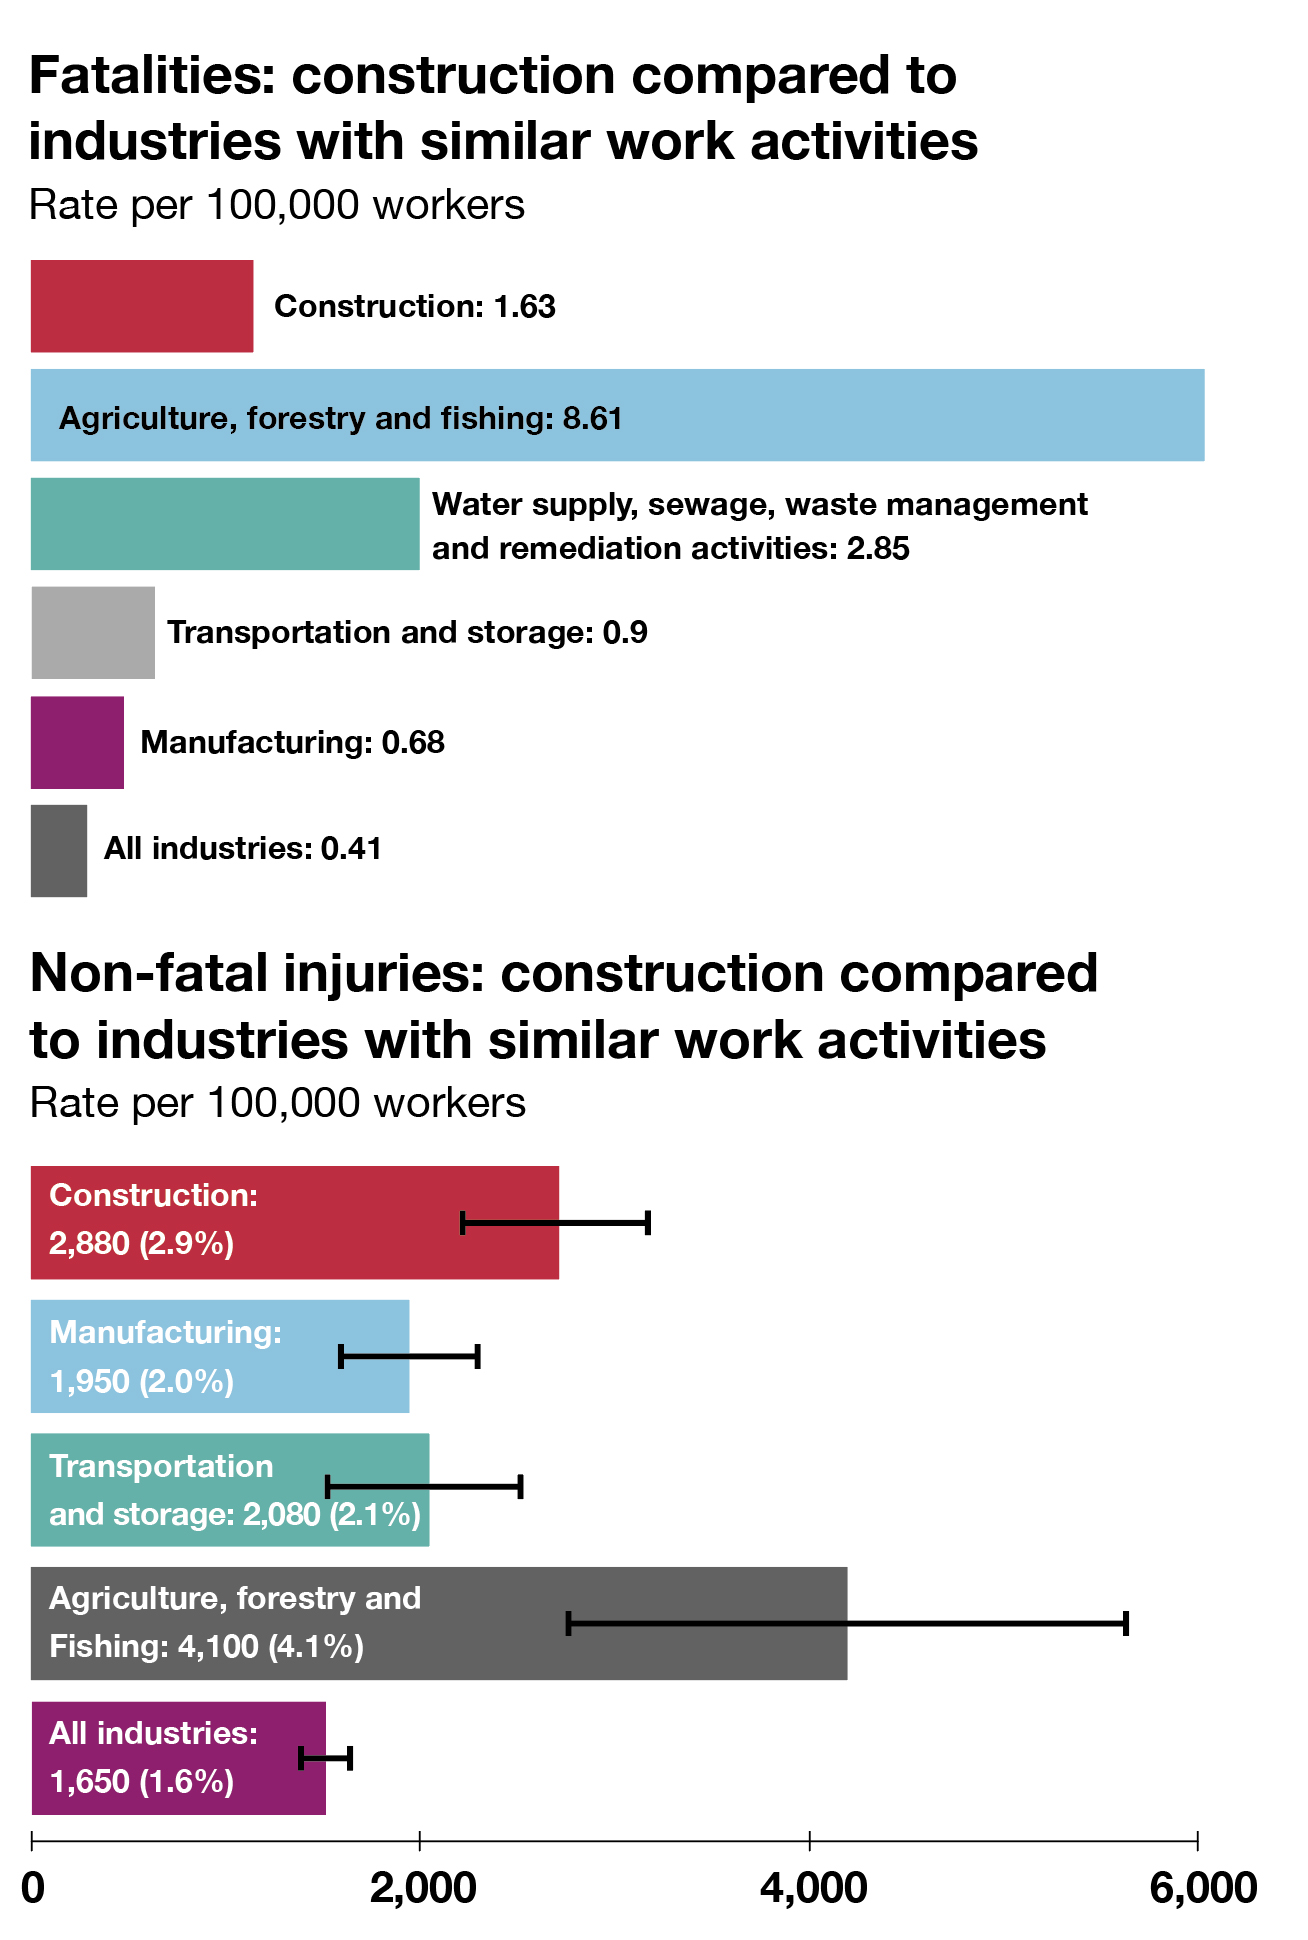
In construction there were 30 fatal injuries to workers and five to members of the public in 2021/22 – a welcome fall on the previous period. Over the past five years there has been an average of 36 fatalities to workers and five to members of the public each year. One fatality is still one too many – and at 1.63 per 100,000 workers the fatal injury rate is around four times the all-industry rate. Over half (51%) of deaths in construction over the same five-year period were due to falls from a height.
Non-fatal injuries
The latest construction report from the HSE estimates – based on Labour Force Survey (LFS) estimated annual average 2019/20-2021/22 – shows that in construction there were 59,000 cases of non-fatal work-related injury. Of these, 39% involved over three days’ and 26% over seven days’ absence.
In the latest year, construction had a non-fatal injury rate of 2,880 per 100,000 workers, which compares to the all-industry rate of 1,650 per 100,000. The HSE points out that around 2.9% of workers in construction suffered from an injury. This rate is statistically significantly higher than that for workers across all industries, which is almost half at 1.6%
All illness
In the latest year, in construction, there were an estimated 78,000 work-related ill-health cases (new or longstanding) of which more than half (53%) were musculoskeletal disorders.
This equates to an ill health prevalence rate of 3,690 per 100,000 workers, which compares to the all-industry rate of 4,030 per 100,000. Around 3.7% of workers suffered from work-related ill health (new or longstanding cases). Again, this rate is not statistically different than the 4.0% rate for workers across all industries.
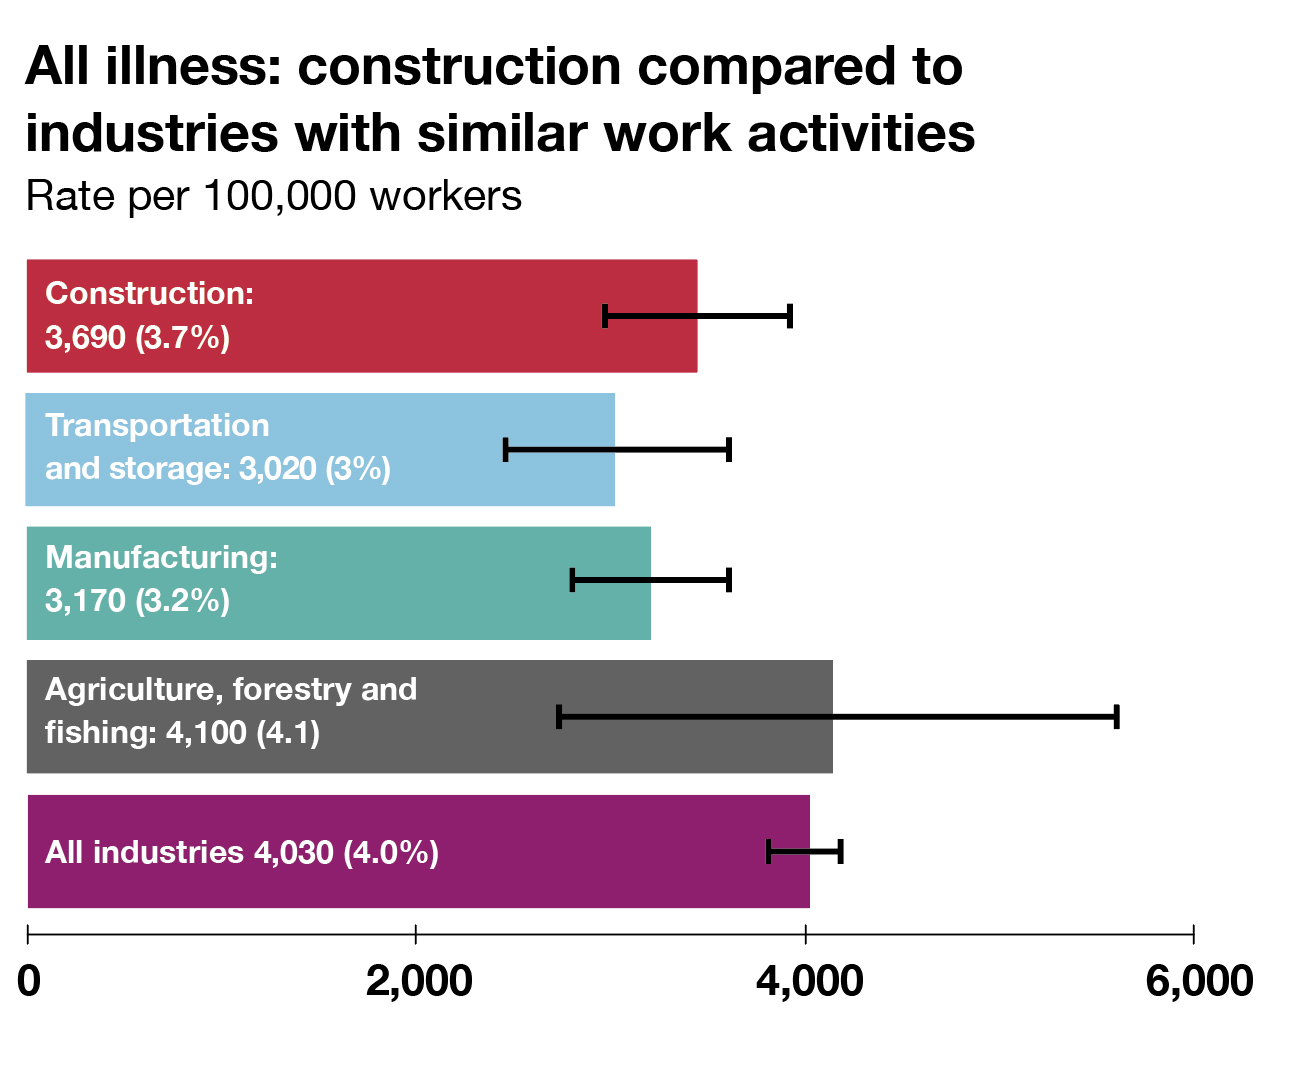
Another illness comparison to note in the HSE construction report was the high prevalence of musculoskeletal disorders of 1,970 per 100,000 workers, which compares to the all-industry rate of 1,110 per 100,000.
However, perhaps surprisingly in the latest year, construction had a stress, depression or anxiety prevalence rate of 980 per 100,000 workers, which compares to the all-industry rate of 2020 per 100,000 – perhaps reflecting that in the sector there is a tendency for workers not to report mental illness, as discussed in the feature on page 12.
Days lost
In construction around 2.2 million working days (full-day equivalent) were lost each year due to workplace injury (25%) and work-related illness (75%). That is equivalent to around 1.1 working days lost per worker, which is not statistically different than the all-industry level (1.0 days), says the HSE.


